![How do we quantify volcanic hazard? One of the most important contributions of geoscience to society is the assessment of natural hazards, particularly the threat […]](/wp-content/uploads/2014/12/santorini-640x258.jpg "Santorini: Myths, Legends and Modern Day Volcanic Threat")
How do we quantify volcanic hazard?
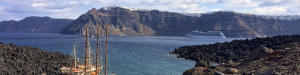
One of the most important contributions of geoscience to society is the assessment of natural hazards, particularly the threat of volcanic eruption to local and global populations. Santorini, an idyllic Greek island in the Cyclades, is a perfect case study of the application of monitoring techniques. It is famous for its last major caldera forming eruption 3600 years ago, which created the characteristic ‘outer ring’ shape, flooded by seawater. This eruption is also believed to be the cause of the fall of the Minoan civilization, on Crete, an island around 70 miles to the south which may have been hit by a tsunami initiated by the eruption. A more speculative popular theory links the island’s ancient city of Akrotiri to Plato’s Atlantis.
Today, two small, dark volcanic islands, Nea Kameni and Palea Kameni can be seen in the centre of the caldera structure. According to Roman history, these islands first emerged from the water 2000 years ago. This demonstrates the two distinct styles of volcanism observed at Santorini – infrequent, explosive, caldera forming eruptions and more common, smaller, dome forming eruptions. One of the major problems in studying this volcano is understanding the behaviour of the magma chamber which effectively controls the size and timing of these eruptions. A recent study by Parks et al 2012 used a variety of techniques to deduce how filling of the magma chamber controls eruptions.
In this study, two major datasets were used to measure the surface deformation of the caldera and the Kameni islands. GPS stations, which can be very accurately located using GPS satellites (like those used for car satellite navigation), are compared to their known locations in a 1955 military study. Secondly, a technique called InSAR (Interferometric Synthetic Aperture Radar) measures the displacement on the scale of centimetres over the entire ground surface. As a satellite passes over the same location on the ground twice, the number of wavelengths between the satellite and the surface (and back) can be counted – although the total number is very large, it is the difference in wavelengths between passes which is important. A difference of 1 wavelength corresponds to around 2cm of ground movement in the line of sight of the satellite. When this is calculated over the entire island and combined with GPS, a very detailed picture of inflation above a shallow magma chamber can be achieved.
By modelling the volume of magma input required to match this inflation, and comparing this to the estimated size of historic eruptions, we can estimate on a scale of decades when and how large the next eruption may be. Based on calculations of lava erupted in recent eruptions, Parks et al anticipate the next eruption will have a volume of ~3-7×10⁷m3. Using the inflation model, approximately 15-60% of this volume has been intruded into the shallow chamber since 2011. However, inflation episodes are not necessarily followed by an eruption. As we have only had GPS and InSAR measurements for around a decade, we do not know how strong the correlation between inflation episodes like this and eventual eruption is.
Parks M.M., Philip England, Tamsin A. Mather, Paraskevi Nomikou, Kirill Palamartchouk, Xanthos Papanikolaou, Demitris Paradissis, Barry Parsons, David M. Pyle & Costas Raptakis & (2012). Evolution of Santorini Volcano dominated by episodic and rapid fluxes of melt from depth, Nature Geoscience, 5 (10) 749-754. DOI: http://dx.doi.org/10.1038/ngeo1562